Dinesh Jinjala

05A multi-tenant Pharma Manufacturing Analytics SaaS

SPC & Process Capability Analytics

Built and owned the engine

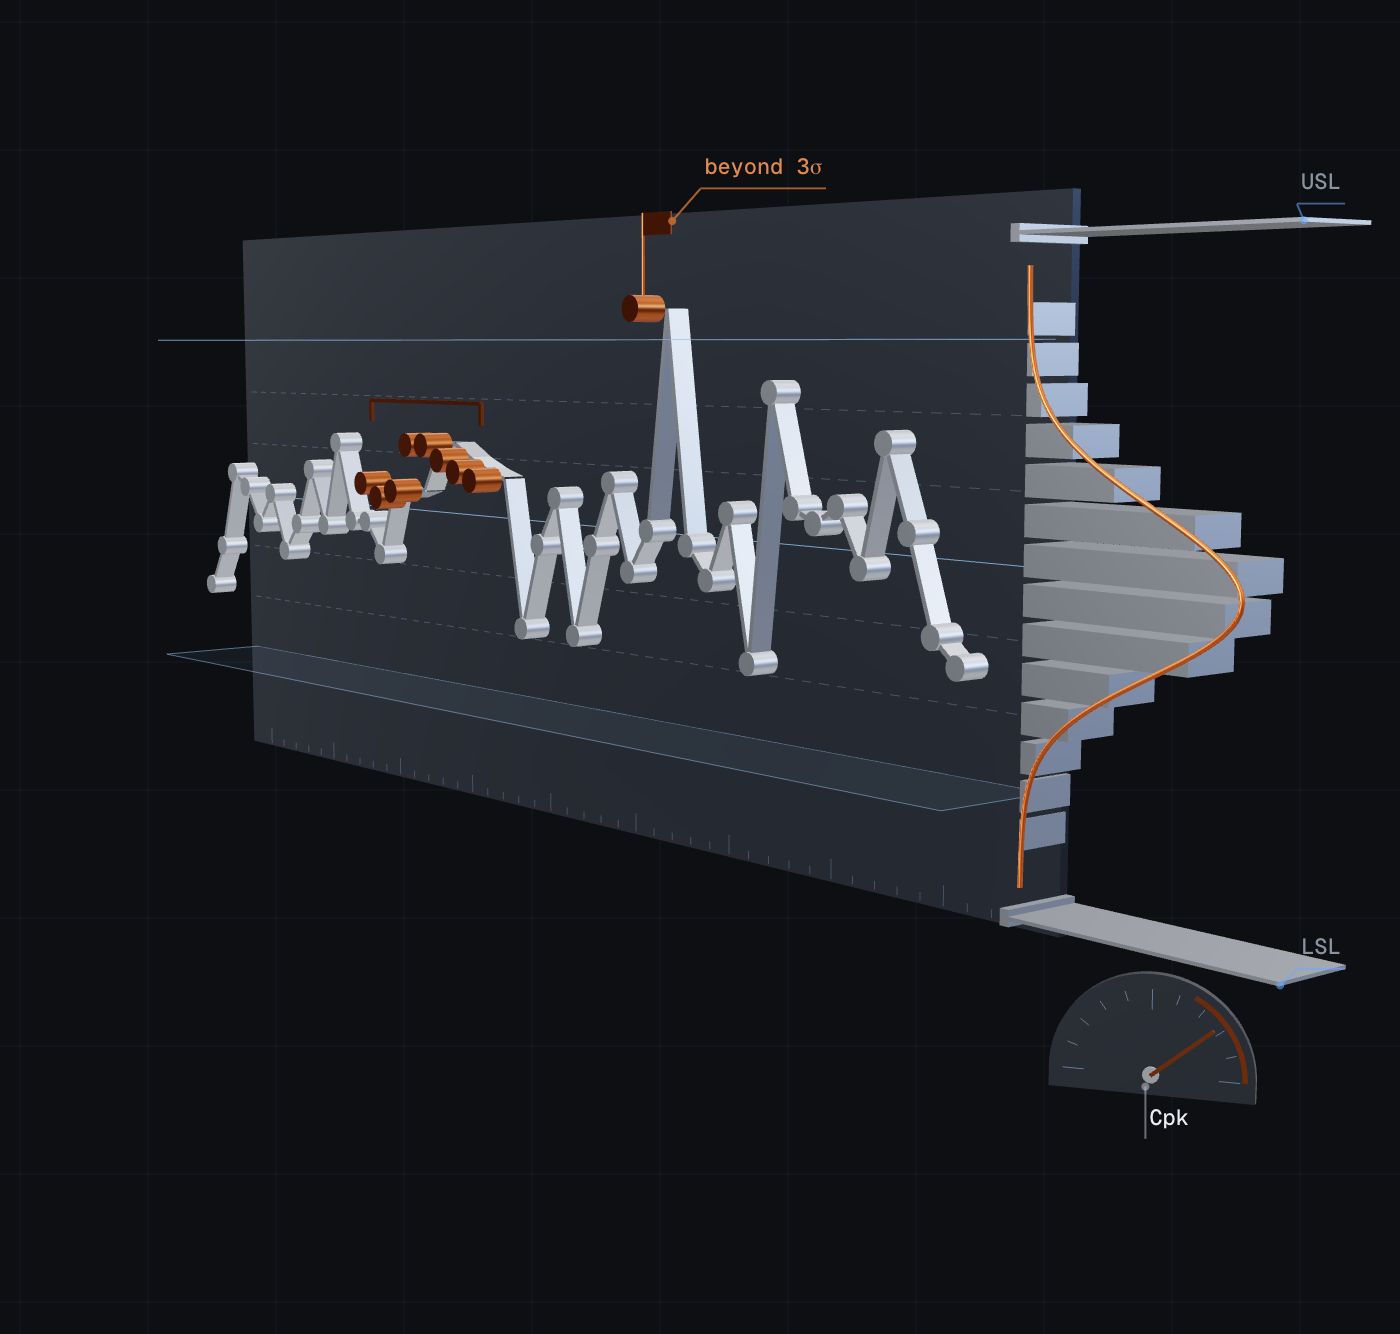
Statistical process control for pharma manufacturing, used by 10+ enterprise clients across their sites. Control charts, run-rule alerts and process capability (Cp/Cpk/Pp/Ppk) come from live batch data, with correct handling of skewed data. I built the first version of the engine and owned it for over three years.

13
chart types (I-MR, EWMA, Pareto…)
10+
enterprise clients, multiple sites each
Cp · Cpk · Pp · Ppk
capability, with Box-Cox or Yeo-Johnson for skewed data

Python / Statistics / PostgreSQL
Problem

Pharma manufacturers must show regulators that each process stays in control across hundreds of batches. Quality engineers needed control charts with limits that change over time, run-rule detection and capability indices, computed from live batch data rather than spreadsheets. Real batch data is often skewed or one-sided, which makes naive Cpk numbers misleading.

Approach

  • I built the first version of the charting and capability engine and owned it as the platform grew.
  • One API serves 13 chart types, from I-MR and EWMA to Pareto.
  • Limits are date-aware, so each batch is judged against the limit that applied at the time.
  • Run rules are configurable per chart, and every flagged point records why, for the audit trail.
  • Capability analysis checks normality first and transforms skewed data before it computes the indices.

Architecture

  1. Batch data
  2. Filters & exclusions
  3. Date-effective limits
  4. Run rules
  5. Capability indices
  6. Charts & violations

Outcome

The engine runs across 10+ enterprise pharma clients, each with multiple manufacturing sites. Quality teams get control charts, violation tables and capability scorecards from live batch data, with a full audit trail.

What I learnedA transformed Cpk only means something if the specification limits go through the same transform as the data.

Building something like this?

Tell me about it